Debugging Tools
Enjoy these notes? Want to Slam Dunk JavaScript?
These are notes based on my Beginner JavaScript Video Course. It's a fun, exercise heavy approach to learning Modern JavaScript from scratch.
Use the code BEGINNERJS for an extra $10 off.
There are 2 parts of debugging:
- there are tools you can use to get info when things go wrong
- the right mindset to be a good problem solver
This video will focus on the tools.
As you go through the course, anytime we start to hit a roadblock, Wes won't cut it out of the video, he will leave it in and show us his thought process.
We will be working out of the 16 - Debugging folder which is in the exercises directory. Within that folder, there should be two files: debugging-START.js and debugging.html.
If you open debugging.html, you will see that it's just a basic html file where we are loading our base CSS, we have a button that says make me bigger and then a script tag that is loading debugging.js which doesn't exist yet.
Make a copy of the debugging-START.js file and save it as debugging.js.
This file contains a bunch of stuff we haven't learned yet:
- arrays of objects,
- loops,
- functions
- event listeners
- etc.
It doesn't matter that we don't know what all those different things do yet, Wes will explain them later and we will learn how to build our own. This is more so we can test different types of debugging.
Console Debugging
We will start with console debugging.
There is console.log() which is the most common one you'll see. 👇
people.forEach((person, index) => {
  console.log(person.name);
});
There is console.info(person.name) which usually gives you a little eye and circle beside the console output but it doesn't seem to be there right now.
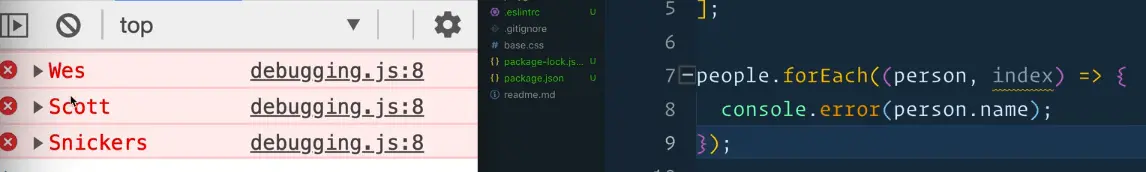
There is console.error(person.name).
That isn't used for throwing or handling errors (we will learn about that), this just changes what the log looks like in the console, as shown below 👇
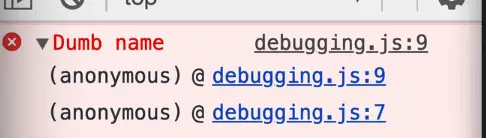
It also gives you a stack trace 👇
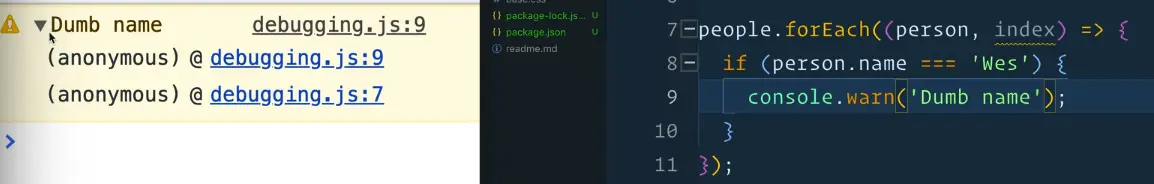
There is console.warn() which is very similar to console.log() 👇
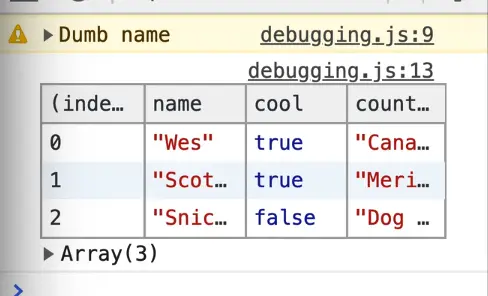
There is console.table().
Anytime you have a list of objects, and the objects have the same property (meaning the objects all have name,cool, and country properties), console.table() will format that into a nice little table.
console.table(people);
There is console.count().
This is useful if you want to know how many times a function is being run.
If we go into the doctorize() function in debugging.js and add console.count('running doctorize');, and then refresh the html page, every time you type doctorize('wes'); in the console, the console will log a count.
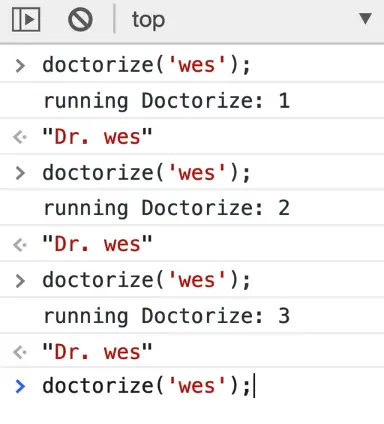
That is useful in a scenario where you aren't sure if a function is running twice, or sometimes you are working with hover elements and it's getting triggered way too often. console.count() will show you how many times it's actually running.
You can also pass variables to console.count(). To demonstrate that, let's change the example to use backticks, like so 👇
function doctorize(name) {
  console.count(`running Doctorize for ${name}`);
  return `Dr. ${name}`;
}
Now if you type in the console doctorize('wes'), it will show the count, but if you run doctorize('snickers');, it goes back to one.
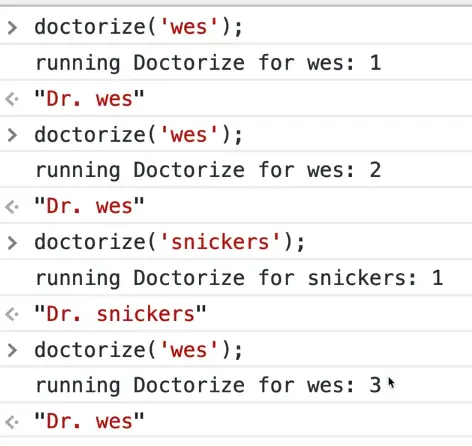
But if you call doctorize('wes'); again, it maintains that count.
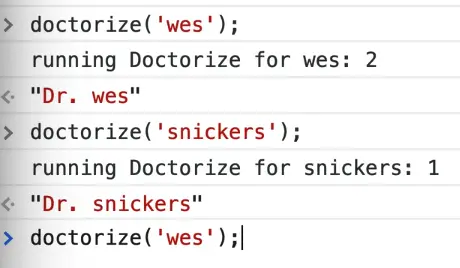
console.count() is based on what strings you pass it.
Next we have console.group(), that can be helpful if you have a bunch of stuff to log.
We will make a function doALotOfStuff to demonstrate this.
Comment out all of the example consoles we have gone over so far.
console.group("Doing some stuff");
👆 Add the code above, and then underneath it, add a few more consoles such as log, warning, error. Then add console.groupEnd() and pass it the same string we had passed to console.group(), like so 👇
function doALotOfStuff() {
  console.group("Doing some stuff");
  console.log("Im one");
  console.warn("watch out!");
  console.error("hey");
  console.groupEnd("Doing some stuff");
}
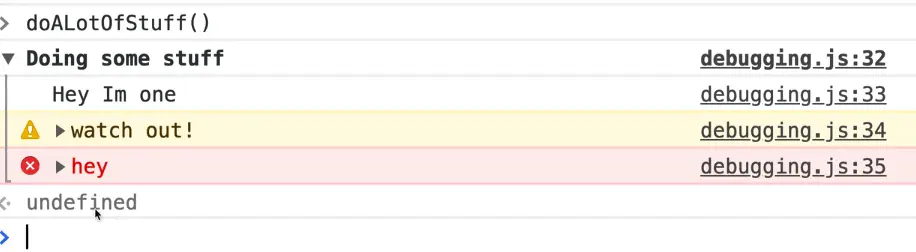
What that does is it groups together all of the logs into a group-able thing, and that can be very helpful.
We will do another example in the people.forEach() method.
people.forEach((person, index) => {
  console.group(`${person.name}`);
  console.log(person.country);
  console.log(person.cool);
  console.log("DONE!!");
  console.groupEnd(`${person.name}`);
});
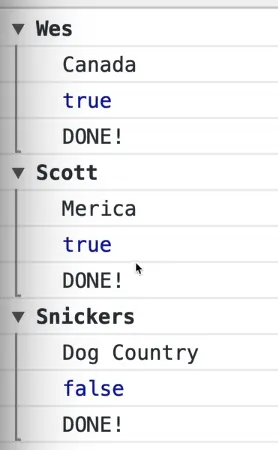
As you can see, it nicely organizes the people into their separate collapsible section. 👆
console.groupCollapsed();
You can actually also use the .groupCollapsed() method shown above 👆 which will by default collapse all the groups, as shown below 👇.

Those are the main console methods that Wes uses to debug something.
Comment out all the console.group() code.
The Call Stack and Stack Trace
Next we will talk about something called the call stack or the stack trace. The stack trace will tell you which function called what function called what function.
If you scroll down to the function go, you will see that it calls doctorize, which will first call greet.
There is a lot going on in the code.
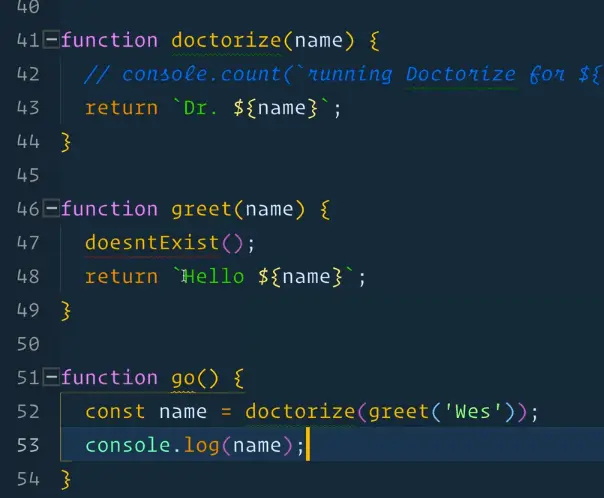
You will notice that inside of greet() we have this function that doesn't exist, and that will cause an error. If we try to run that from the console, you will see an uncaught reference error.
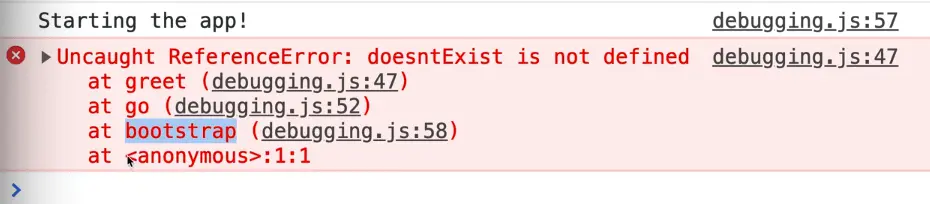
If you expand the error, you should see a few messages below, which are often ignored by new developers but are actually very useful in debugging.
If you want to know what went wrong, you have to get good at reading the call stacks. It's pretty simple!
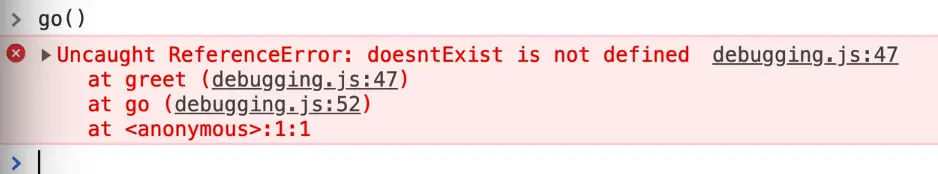
In the error log above, the console is letting us know that the error happened at the greet() function, which is on line 47 of debugging.js. This is where the actual error happened.
That is good, but errors aren't always that easy.
You might need to know where the greet() function was called from.
To figure that out, you would go to the next line which tells you that it was called by go() on line 52.
And then it says at <anonymous>:1:1. What does that mean?
We are getting that message because we called the function from the console.
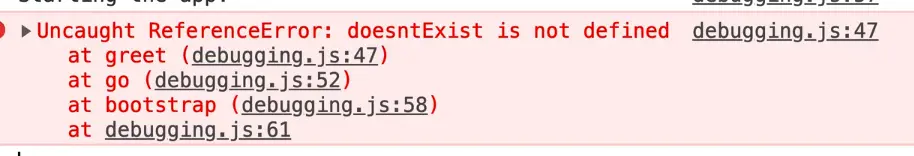
That would look different if we actually made another function that called go instead like so 👇
function bootstrap() {
  console.log('starting the app!');
  go();
}
If you call bootstrap() from the console, you will see 👇
If you were to modify debugging.js to add a call to bootstrap on page load like so: bootstrap();, you won't see that anonymous function line in the call stack.
Go ahead and comment out the bootstrap() call now.
Grabbing Elements
Next we will learn about the grabbing of elements.
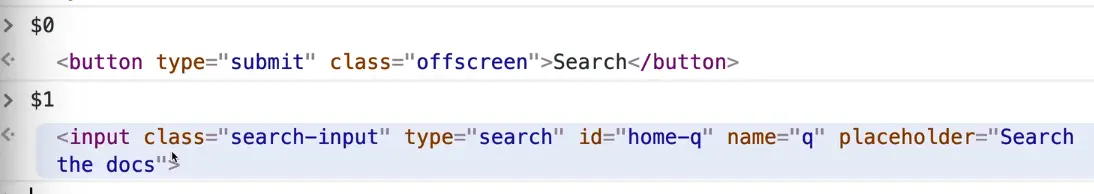
This is a handy tip that Wes uses often. If you're on a website, and you're inspecting it, and focusing on an element such as this input from Mozilla's website by clicking on it in the element inspector, if you flip over to the console and type $0, it will return to you whatever element you had currently selected in the elements tab.
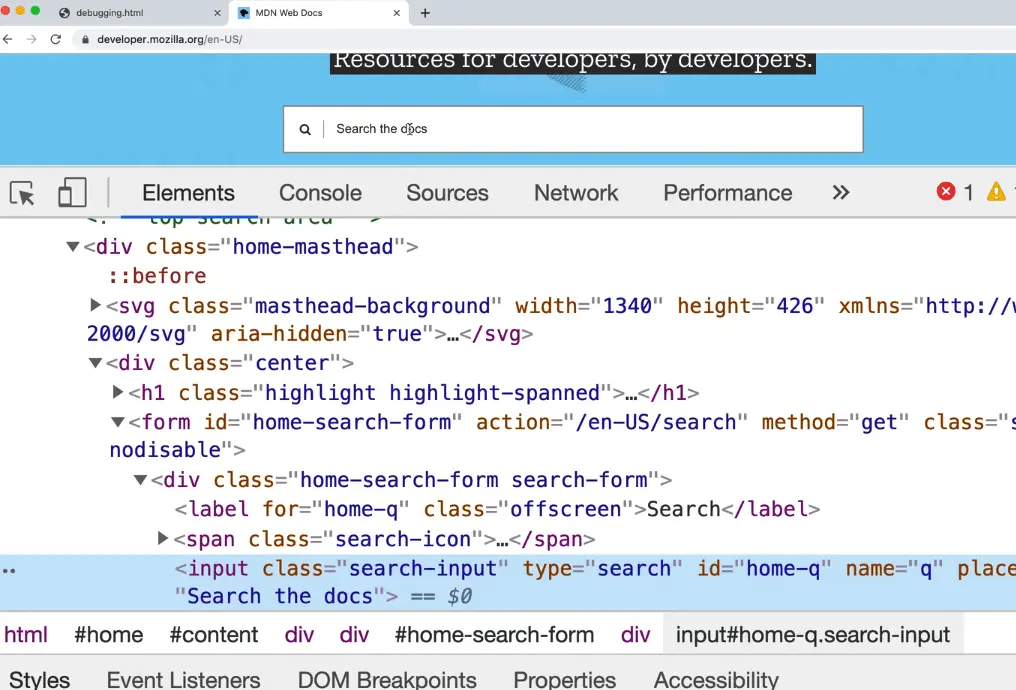
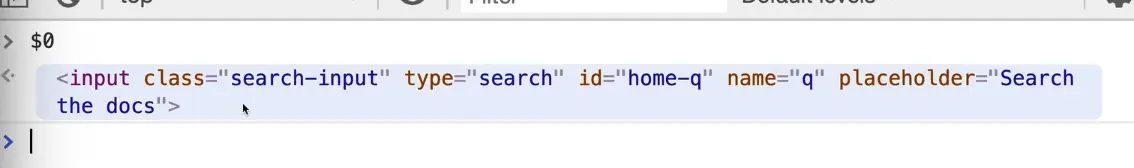
That is very useful because now you could do something like call $0.value() against it, and it will tell you what you have typed inside the input.

You might be wondering, what does 0 in the $0 mean.
It means the last element that was clicked.
If you were to go back to the elements tab, select another element like a button, when you go back to the console $0 will give you the button element and$1 will give you the input.
You can keep going forever, if you click another element, it will remember the order in which they were clicked.
Another cool thing you can do is to use the $ and $$ symbol in the console.
You cannot use these things in your code, it only works in the console. Also, if jQuery is loaded on the page, that won't work.
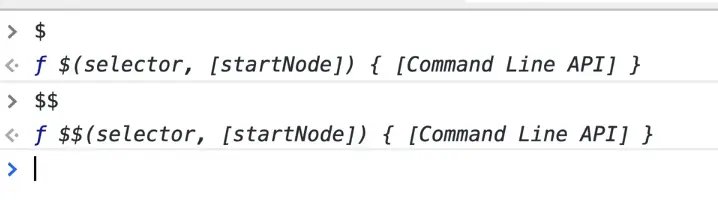
👆 Those are shorthand selectors for two things we will learn about in a future video about the DOM. Those selectors will allow us to select things based on selectors.
$('p') will give us document.querySelector(), which will match the first thing that matches the selector passed.
$$('p') will match ALL of the elements that match the selectors.
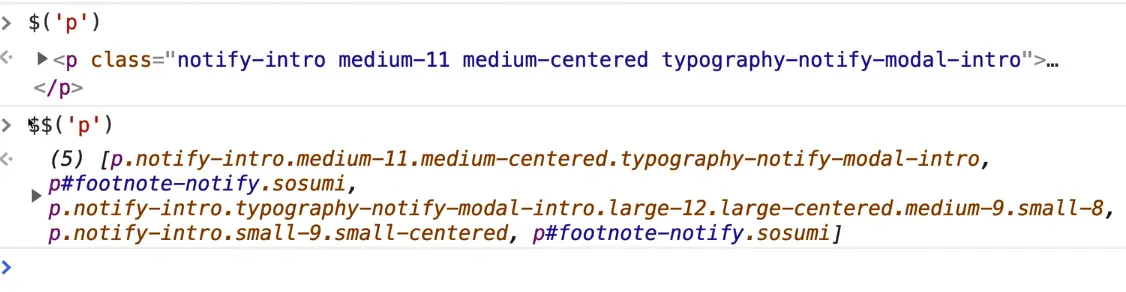
In the value returned from $('p') you can see it found the first paragraph, and with $$('p'), it found all of the p elements on the page.
Breakpoints
Next we will talk about breakpoints.
console.log(person.name);
Go into the people.forEach() method and delete all the logs that we had commented out within it and add the code above 👆
If you refresh the html page, you will see everyone's name logged to the console.
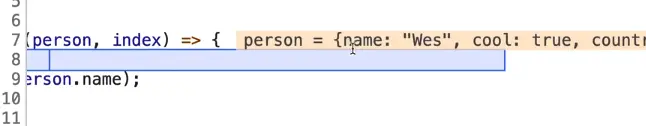
What you can do is, within the people.forEach() method, if you want to pause JavaScript from running, you can type debugger;, like so 👇
people.forEach((person, index) => {
  debugger;
  console.log(person.name);
});
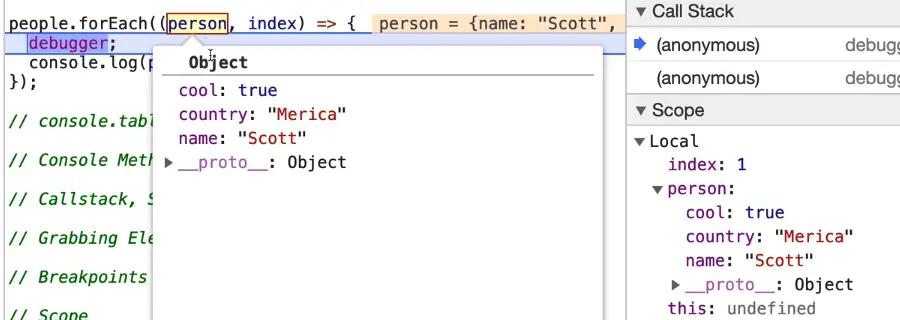
That is a statement that only takes into effect when your dev tools are open, and it will pause JavaScript from running and allow us to peer into JavaScript at that very moment.
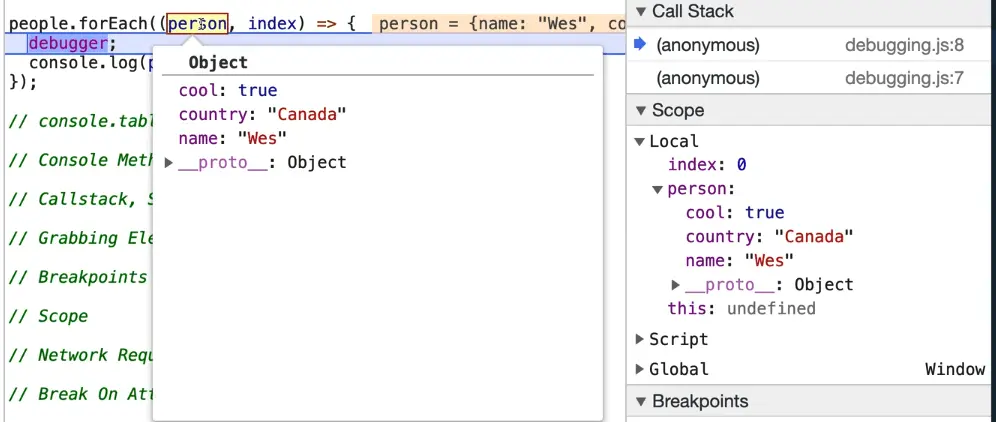
If you refresh debugging.html now, what happens is that we have set what is called a breakpoint. When you set a breakpoint, you are telling JavaScript to break execution of code when it reaches that line.
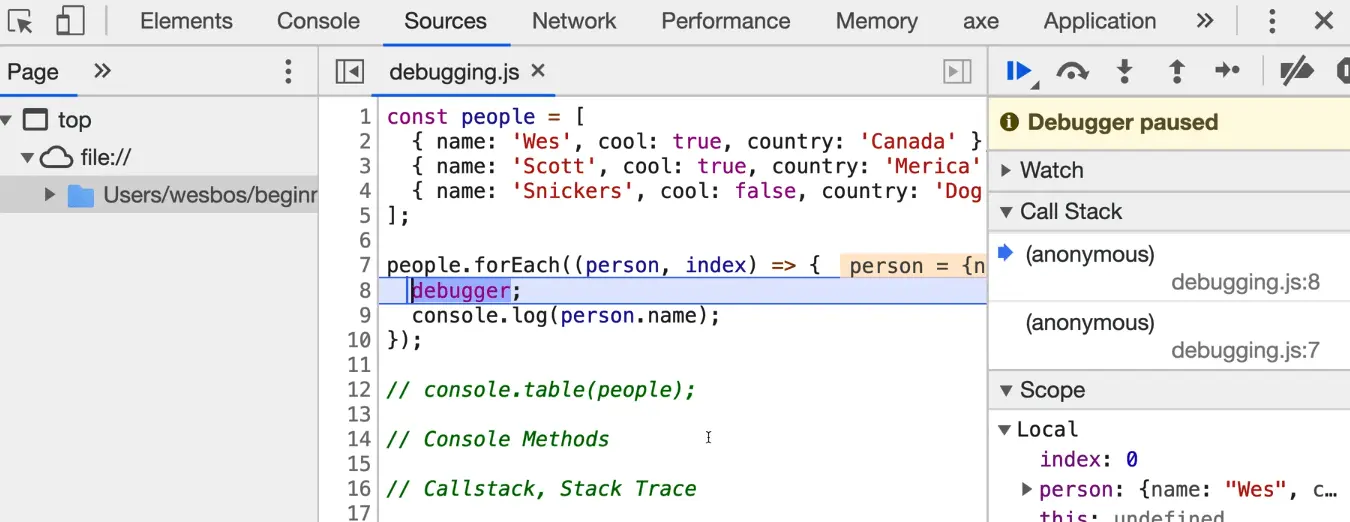
This gives you a whole bunch of information as to what happened.
If you hover over it, it will show you what the variables are equal to at this point in time.
You can see that the JavaScript has paused and if you go to the console, you will see that nothing has been logged yet.
Flip back to the sources tab.
On the right hand-side of the Sources tab, that is where all the different tools for inspecting what is going on reside.
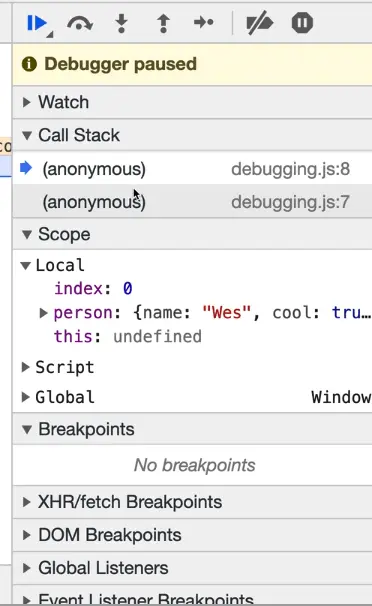
We get the call stack, which we learned about earlier.
It will also let us know what the local variables are.
You can expand the collapsed Local section within the Scope section, or hover over a variable to see it's value.
There are other sections for breakpoints which we will get to in a second.
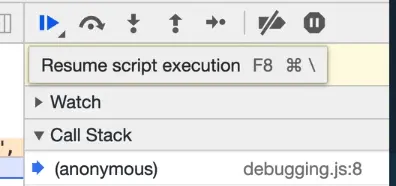
What is cool is you can click the play button shown above , and then if you flip back to the console, you will see that the name "Wes" has been logged.
What happened there is when the function first ran, it hit the breakpoint and then when we pressed play, it logged the first persons name and then because it's in a loop, it hit the breakpoint again and paused.
Now you can see that the second person is equal to Scott.
You can also step over into the next function call like so 👇
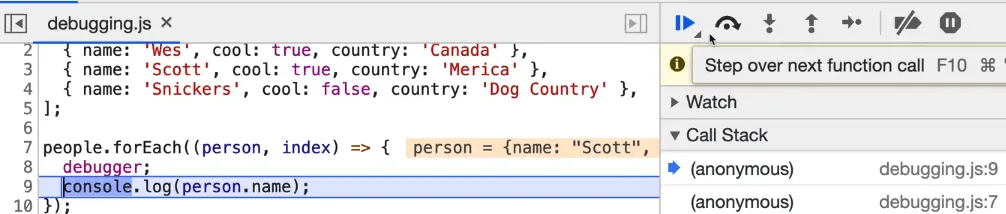
When you hit play, it will just continue execution of the code until it hits the next breakpoint.
If you click the option beside the play button that says "Step over next function call", it allows you to run the code line by line.
When you feel like you are logging too much data in order to see it, or you are logging something quickly so you can see what happened in the past, adding a debugger (it can go anywhere in your JavaScript code) can be very helpful.
It's a handy way to slow things down and peer into what the different pieces of data are.
You can also set breakpoints from the browser as well.
Remove the line of code in debugger.js that says debugger; and refresh debugging.html in the browser.
Open the sources tab.
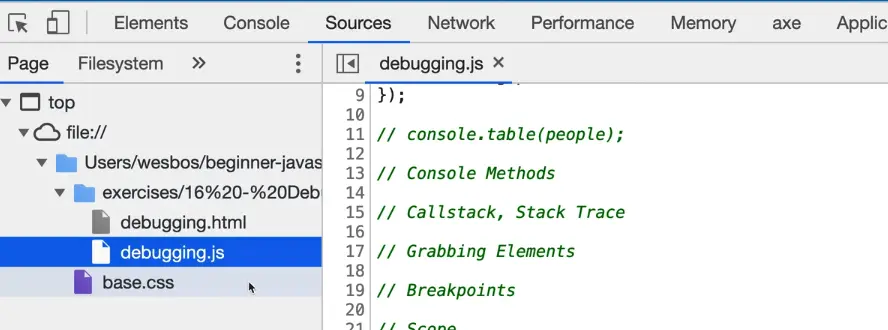
In the sidebar on the left, you can click on your actual JavaScript files that are loaded on the page, and then you can say something like "when someone runs this go() function, I want to put a breakpoint in there"
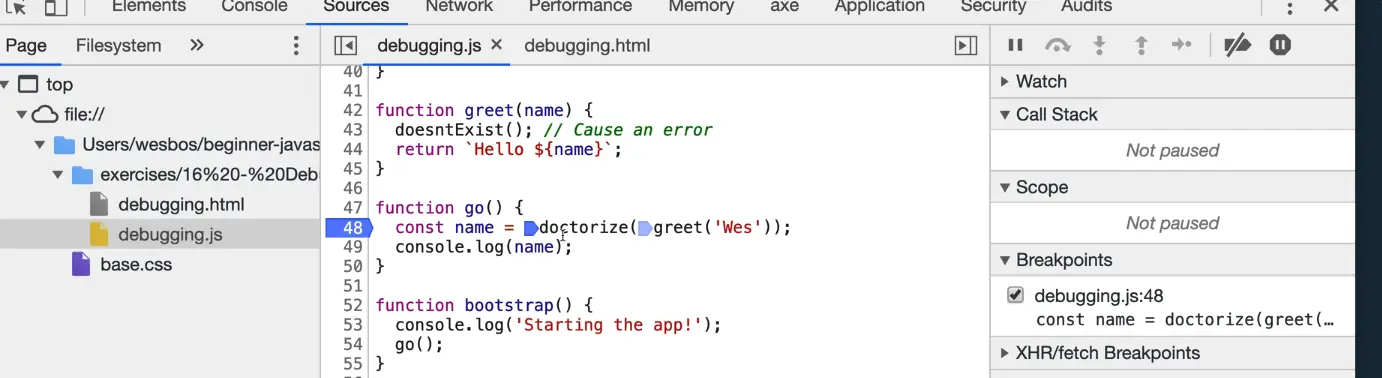
What you do is you click the line number next to the line of code that you would like to pause during.
If you go into the console and type go(), you will see that the code pauses itself in the debugger at the line where you set the breakpoint.
Recap: you can either create the breakpoint by clicking next to the line number in the sources tab, or adding the word debugger; anywhere in your JavaScript.
Always make sure you remove those debugger; calls from your code once you are finished!
We talked about scope earlier. Scope will allow us to peer into what variables are, we will look at that more in the next video.
Network Request
The next one is Network Request.
This is useful if you want to see what is being fired off when you load the page. If you go to your networks tab and refresh debugging.html, you will see all of the different files that are needed in order for the page to work.
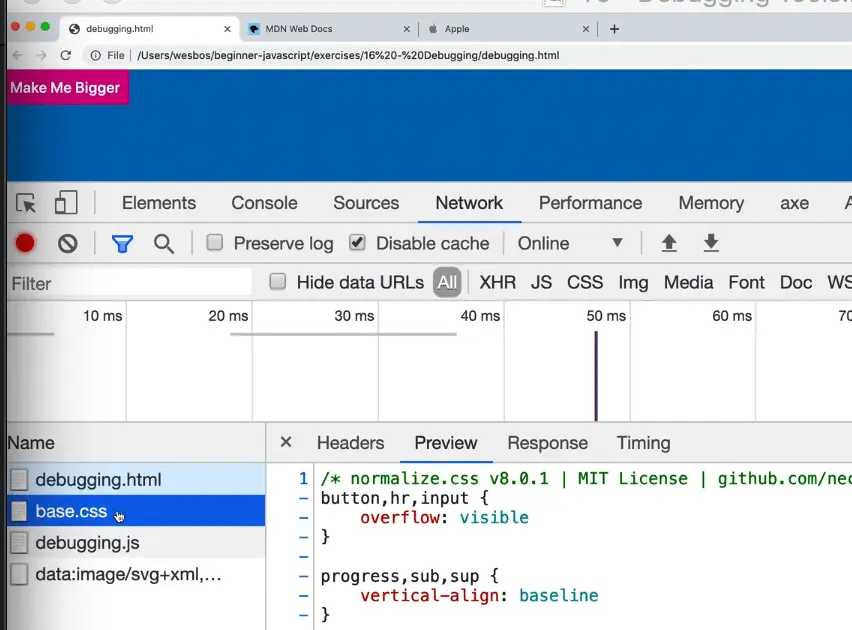
This is helpful because you can see when the data is being sent to you.
Wes added a function to debugging.js called fetchDadJoke().
What that function will do is go off to an API and grab a random dad joke.
Don't worry about what all the lines of code mean here, we will go over that in future videos. For now, just know that it goes to an external API and grabs a joke.
// A Dad joke fetch
async function fetchDadJoke() {
  const res = await fetch("https://icanhazdadjoke.com/", {
    headers: {
      Accept: "text/plain",
    },
  });
  const joke = await res.text();
  console.log(joke);
  return joke;
}
If you were to run the fetchDadJoke() function in the console, it will return a dad joke and log it to the console.
If you go back to the network tab, you will see that there is a new item that has been logged.
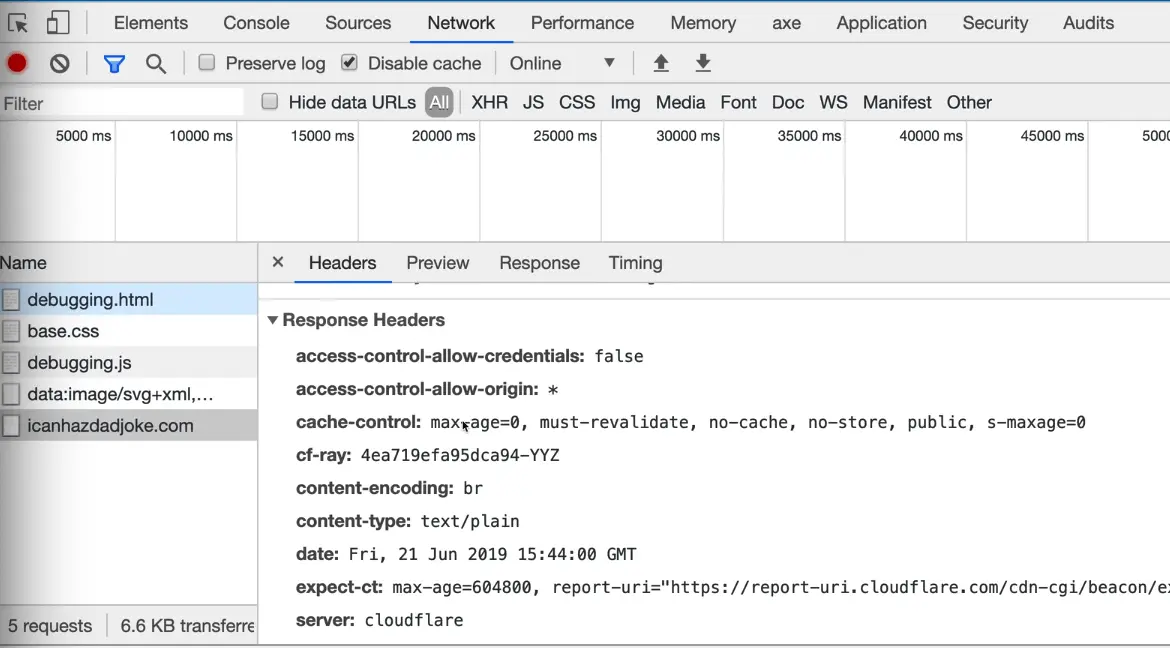
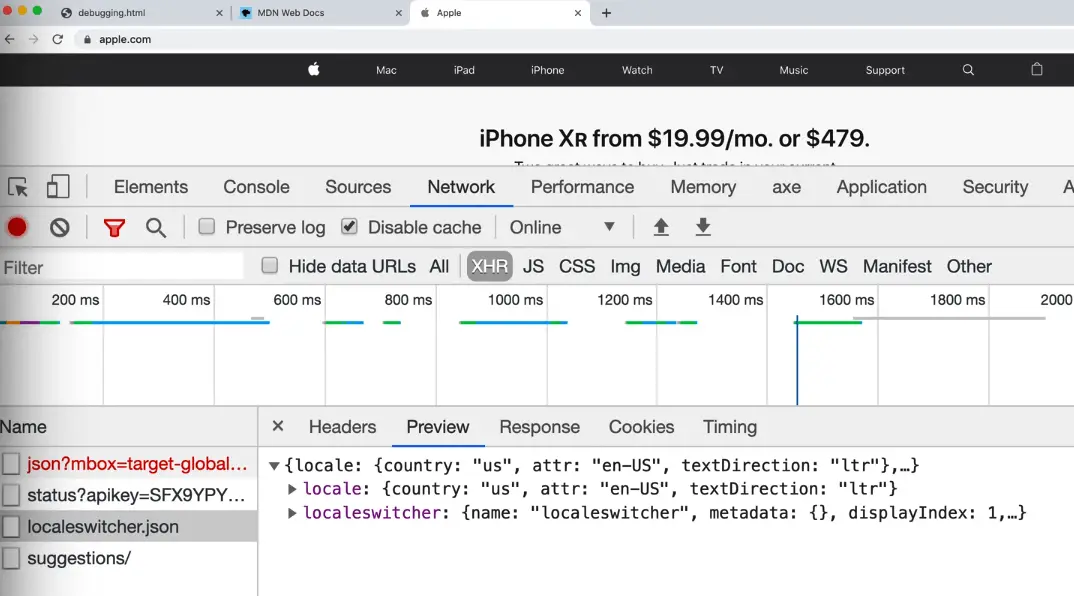
This tells you the information about the request, what actually happened, the raw response and a preview of it. It gives you information such as how long did this request take.
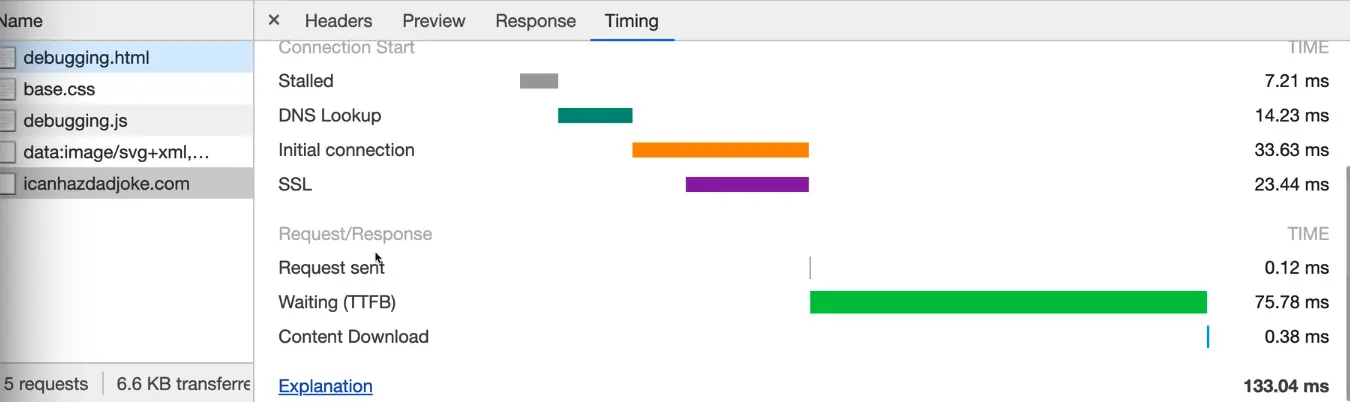
For example, if your website is slow, it will tell you how long the request took, and where the time was spent.
To demonstrate this, go to http://apple.com and inspect the network tab.
You will see that there are 100s of things that are requested. You can also filter out the requests within the network tab such as XHR, which is when they're sending data out about you.
Break On Attribute
Next we will go over break on attribute. Wes doesn't use this one often, but it can be useful.
On debugging.html there is a button that says "Make me bigger".
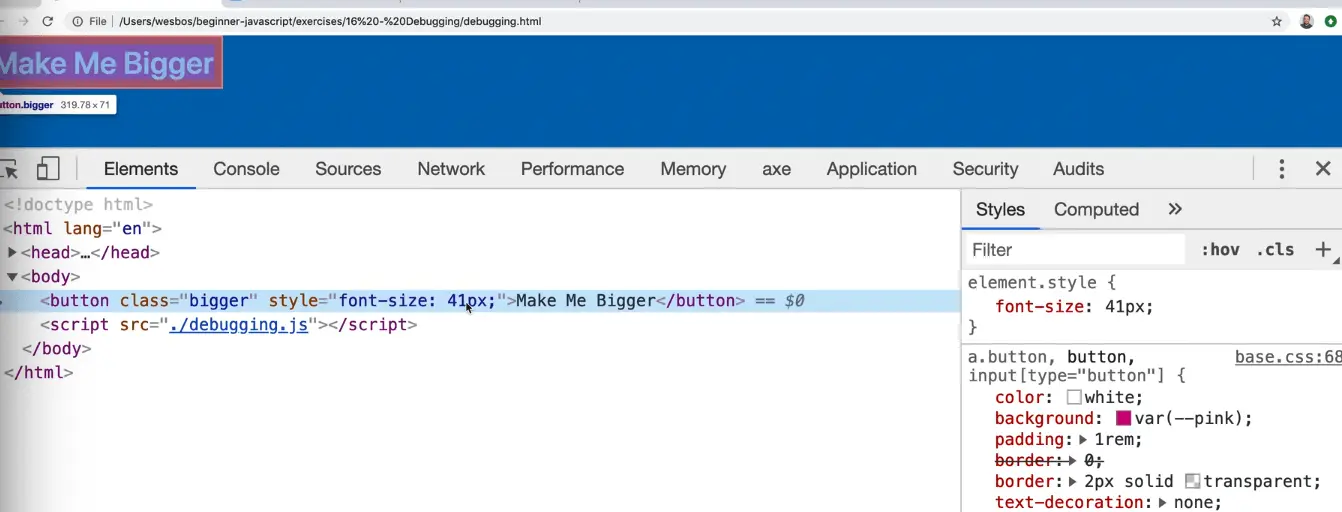
When you click it, it gets bigger.
If you go to your elements, you will see that the font-size is just being bumped up every time the button is pressed.
If you don't know where the JavaScript is that is making that button bigger, you can go into you button in the elements tab of dev tools and select Break on > Attribute Modifications.
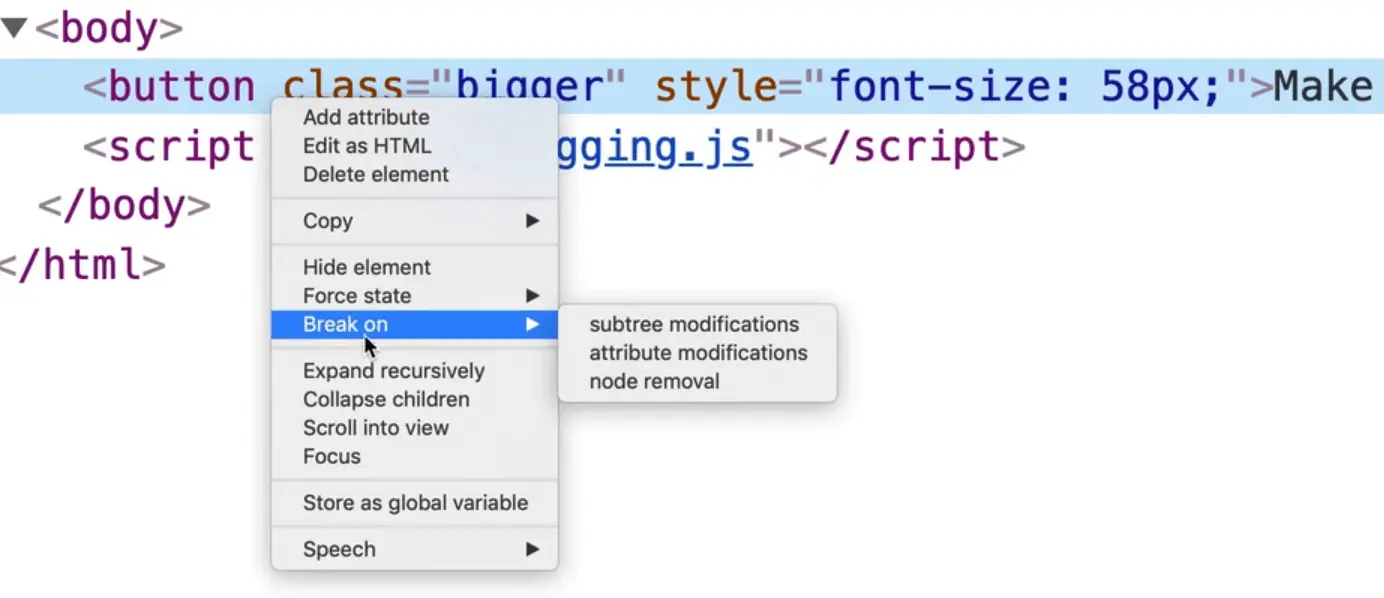
This is just another way of adding a breakpoint.
There is also something called subtree modifications which is what it is referred to when somebody adds a div for example.
There is also something called node removal which is when someone removes an element or text from something.
We will just focus on attribute modifications.
Set the breakpoint on attribute modification and now when we click the button, the breakpoint should be triggered and bring us to the sources tab which will show you where that attribute is being modified from.
That is very useful when you get thrown into a random code base where you don't really know what is going on.
Finally, if you go to the sources tab again, you will see that there are other things on the right hand side.
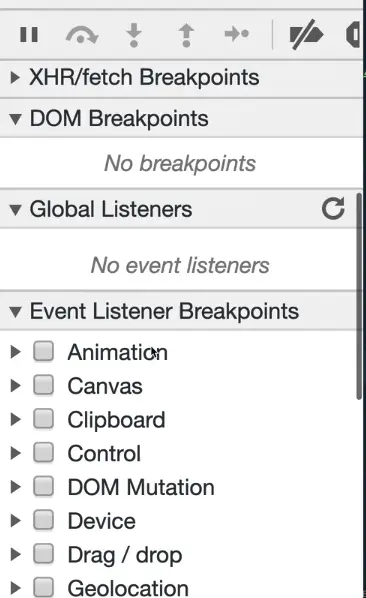
You can throw Event Listener breakpoints, such as mouse click. 👇

If you add that breakpoint, now when you click on the button, it will throw a debugger breakpoint for you.
There are also XHR breakpoints:
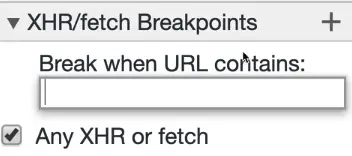
If you click Any XHR or fetch, what that will do is anytime a fetch request is made, anytime someone goes off to an external API, the code will break execution.
To test this you can set the breakpoint option and then go into the console and try typing fetchDadJoke().
You will see that it pauses in the debugger where the fetch request is made and we can actually step through it.
Wes would estimate that around 98% of the debugging that he does is done using console.log, breakpoints and network requests.
He will turn to the other types of debugging tools available typically in severe edge cases where he is stumped.
Find an issue with this post? Think you could clarify, update or add something?
All my posts are available to edit on Github. Any fix, little or small, is appreciated!
 Cottage in Ontario
go into debt if you have to
Cottage in Ontario
go into debt if you have to  Claude code reverse engineered this RC car!
It only worked with a custom wyze cam firmware, and now I can drive it over USB or a cheap ESP32
Claude code reverse engineered this RC car!
It only worked with a custom wyze cam firmware, and now I can drive it over USB or a cheap ESP32  this guy wanted to know how LLMS actually work, so he wrote one from scratch
this is the best thing i've watched in a long time
this guy wanted to know how LLMS actually work, so he wrote one from scratch
this is the best thing i've watched in a long time