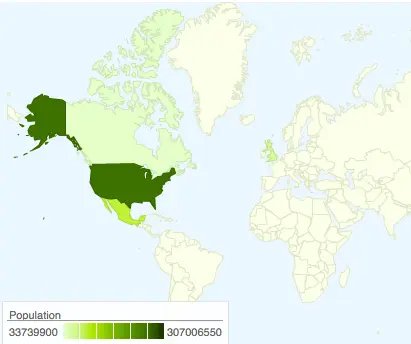
Using jQuery, JSON and Google’s Visualization Geo API Together
Was helping someone out in the jQuery IRC channel today and they were having some trouble with a JSON api that they were using. To simply put it they wanted to:
* Load a JSON file via Ajax

* Parse the results

* Pass it to <a href="http://code.google.com/apis/ajax/playground/?type=visualization#geo_map" target="_blank">Google's Visualization</a> into a data table

* Create a map based on that data.
Now the example given is great, however it doesn't jive well when you want to add in a friendly library like jQuery. So here is how we fixed it:
The JSON Data in regiontop10.json
[
    {
        "DisplayName": "United States",
        "Name": "US",
        "population": 307006550
    },
    {
        "DisplayName": "Canada",
        "Name": "CA",
        "population": 33739900
    },
    {
        "DisplayName": "United Kingdom",
        "Name": "GB",
        "population": 61838154
    },
    {
        "DisplayName": "Mexico",
        "Name": "MX",
        "population": 107431225
    }
]
Then we just needed load the data from this file and create the map. Comments on how this code works are inline.
    google.load('visualization', '1', {packages: ['geomap']});

    $(function() {
            // when document loads, grab the json
            $.getJSON('regiontop10.json', function(data) {
                // once grabbed, we run this callback

                // setup the new map and its variables
                var map = new google.visualization.DataTable();
                    map.addRows(data.length);  // length gives us the number of results in our returned data
                    map.addColumn('string', 'Country');
                  map.addColumn('number', 'Population');

                // now we need to build the map data, loop over each result
                $.each(data, function(i,v) {
                    // set the values for both the name and the population
                    map.setValue(i, 0, v.DisplayName);
                    map.setValue(i, 1, v.population);
                });
                // finally, create the map!
                var geomap = new google.visualization.GeoMap(
                  document.getElementById('visualization'));
                      geomap.draw(map, null);

            });
   });
And that is it! Take a look at the demo and view source for the rest of the HTML markup.
Find an issue with this post? Think you could clarify, update or add something?
All my posts are available to edit on Github. Any fix, little or small, is appreciated!
